 WhiteSites Blog
WhiteSites Blog
WhiteSites Blog

Hi there,
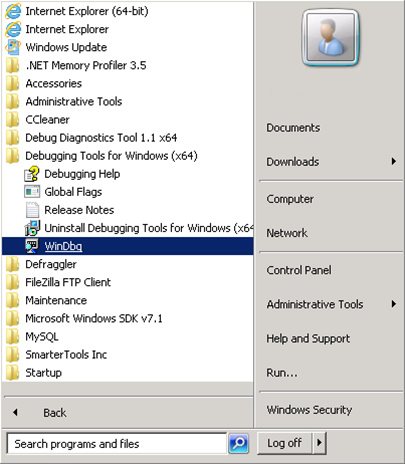
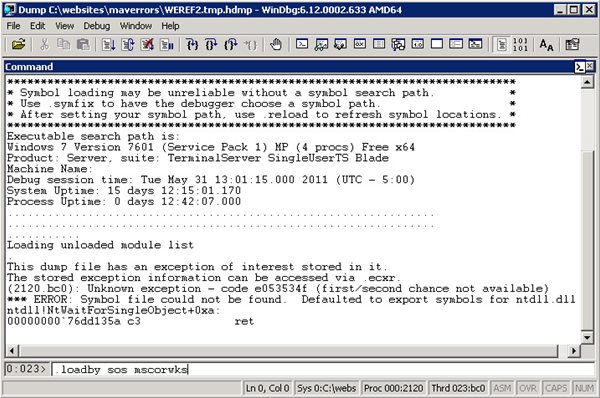
When I try to .loadby sos mscorwks it says "unable to find module mscorwrk"
Please let me know what to do.
Thanks
Hi there,
When I try to .loadby sos mscorwks it says "unable to find module mscorwrk"
Please let me know what to do.
Thanks
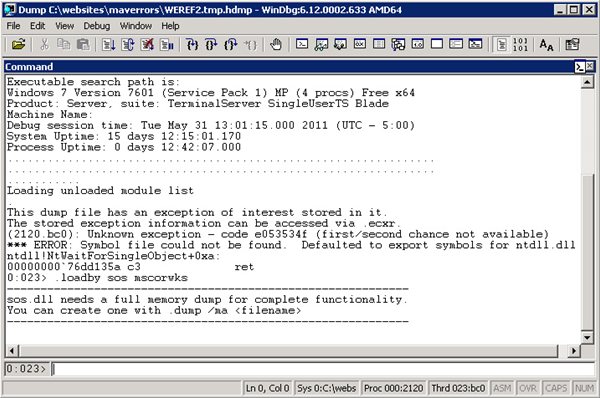
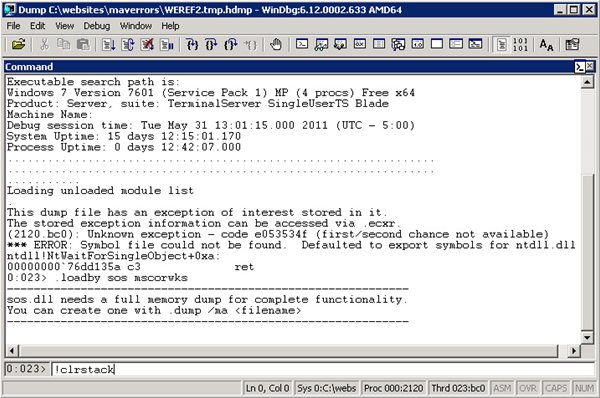
@Paul : I tried .loadby sos clr and it worked. now when I give command !clrstack. it says
OS Thread Id: 0x1f80(39)
Unable to walk the managed stack. The current thread is likely not a manged thread. You can run !threads to get a list of managed threads in the process.
Please let me know what's wrong. I created dump file using dubug diagnostic tool. I really want to see stack to find out the issue.
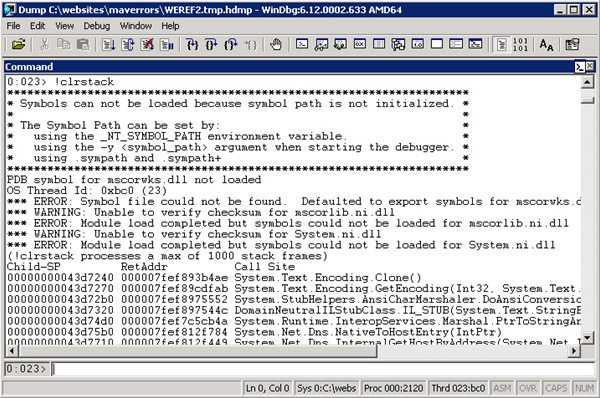
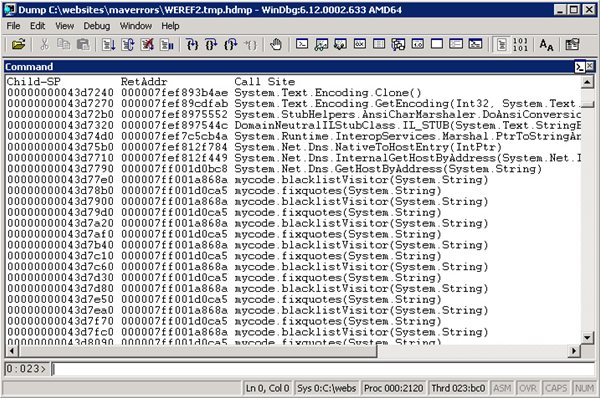
@Paul. Somehow I managed to get it worked. after give .loadby clr and !stackclr I am get the below and I dont understand where the problem lies. can you please help? Thanks in advance
0:005> .loadby sos clr
0:005> !clrstack
*** ERROR: Symbol file could not be found. Defaulted to export symbols for clr.dll -
PDB symbol for clr.dll not loaded
OS Thread Id: 0x17bc (5)
Child SP IP Call Site
010cb614 7579c41f [GCFrame: 010cb614]
010ccfc4 7579c41f [GCFrame: 010ccfc4]
010cd058 7579c41f [InlinedCallFrame: 010cd058]
010cd054 6ee71943 DomainNeutralILStubClass.IL_STUB_PInvoke(System.String, Boolean, Boolean, Boolean, System.Runtime.CompilerServices.StackCrawlMarkHandle, Boolean, System.Runtime.CompilerServices.ObjectHandleOnStack)*** WARNING: Unable to verify checksum for mscorlib.ni.dll
*** ERROR: Module load completed but symbols could not be loaded for mscorlib.ni.dll
010cd058 6ede1244 [InlinedCallFrame: 010cd058] System.RuntimeTypeHandle.GetTypeByName(System.String, Boolean, Boolean, Boolean, System.Runtime.CompilerServices.StackCrawlMarkHandle, Boolean, System.Runtime.CompilerServices.ObjectHandleOnStack)
010cd0b4 6ede1244 System.RuntimeTypeHandle.GetTypeByName(System.String, Boolean, Boolean, Boolean, System.Threading.StackCrawlMark ByRef, Boolean)
010cd0dc 6ede0fb3 System.RuntimeType.GetType(System.String, Boolean, Boolean, Boolean, System.Threading.StackCrawlMark ByRef)
010cd0fc 6ede29f3 System.Type.GetType(System.String)
010cd10c 6e49df7d System.CodeDom.Compiler.CompilerInfo.get_IsCodeDomProviderTypeValid()*** WARNING: Unable to verify checksum for System.ni.dll
*** ERROR: Module load completed but symbols could not be loaded for System.ni.dll
010cd114 6bad029e System.Web.Compilation.CompilationUtil.GetRecompilationHash(System.Web.Configuration.CompilationSection)*** WARNING: Unable to verify checksum for System.Web.ni.dll
*** ERROR: Module load completed but symbols could not be loaded for System.Web.ni.dll
010cd1f8 6bb15fc4 System.Web.Configuration.CompilationSection.get_RecompilationHash()
010cd22c 6bacf553 System.Web.Compilation.BuildManager.CheckTopLevelFilesUpToDate2(System.Web.Compilation.StandardDiskBuildResultCache)
010cd27c 6bacf144 System.Web.Compilation.BuildManager.CheckTopLevelFilesUpToDate(System.Web.Compilation.StandardDiskBuildResultCache)
010cd2a8 6bacee53 System.Web.Compilation.BuildManager.RegularAppRuntimeModeInitialize()
010cd2bc 6bace706 System.Web.Compilation.BuildManager.Initialize()
010cd2d0 6bb172ec System.Web.Compilation.BuildManager.InitializeBuildManager()
010cd308 6baca043 System.Web.HttpRuntime.HostingInit(System.Web.Hosting.HostingEnvironmentFlags, System.Security.Policy.PolicyLevel, System.Exception)
010cd360 6bac9e1c System.Web.HttpRuntime.InitializeHostingFeatures(System.Web.Hosting.HostingEnvironmentFlags, System.Security.Policy.PolicyLevel, System.Exception)
010cd374 6bac8716 System.Web.Hosting.HostingEnvironment.Initialize(System.Web.Hosting.ApplicationManager, System.Web.Hosting.IApplicationHost, System.Web.Configuration.IConfigMapPathFactory, System.Web.Hosting.HostingEnvironmentParameters, System.Security.Policy.PolicyLevel, System.Exception)
010cd3bc 6bac8489 System.Web.Hosting.HostingEnvironment.Initialize(System.Web.Hosting.ApplicationManager, System.Web.Hosting.IApplicationHost, System.Web.Configuration.IConfigMapPathFactory, System.Web.Hosting.HostingEnvironmentParameters, System.Security.Policy.PolicyLevel)
010cd67c 6faa21bb [GCFrame: 010cd67c]
010cd660 6faa21bb [GCFrame: 010cd660]
010cd808 6faa21bb [ContextTransitionFrame: 010cd808]
010cd958 6faa21bb [GCFrame: 010cd958]
010cd93c 6faa21bb [GCFrame: 010cd93c]
010cebcc 6faa21bb [CustomGCFrame: 010cebcc]
010cebe0 6faa21bb [CustomGCFrame: 010cebe0]
010cebf4 6faa21bb [CustomGCFrame: 010cebf4]
010cec08 6faa21bb [CustomGCFrame: 010cec08]
010cec1c 6faa21bb [CustomGCFrame: 010cec1c]
010cec30 6faa21bb [CustomGCFrame: 010cec30]
010cec44 6faa21bb [CustomGCFrame: 010cec44]
010cf018 6faa21bb [TPMethodFrame: 010cf018] System.Web.Hosting.HostingEnvironment.Initialize(System.Web.Hosting.ApplicationManager, System.Web.Hosting.IApplicationHost, System.Web.Configuration.IConfigMapPathFactory, System.Web.Hosting.HostingEnvironmentParameters, System.Security.Policy.PolicyLevel)
010cf038 6bac79d8 System.Web.Hosting.ApplicationManager.CreateAppDomainWithHostingEnvironment(System.String, System.Web.Hosting.IApplicationHost, System.Web.Hosting.HostingEnvironmentParameters)
010cf228 6bac66ef System.Web.Hosting.ApplicationManager.CreateAppDomainWithHostingEnvironmentAndReportErrors(System.String, System.Web.Hosting.IApplicationHost, System.Web.Hosting.HostingEnvironmentParameters)
010cf264 6bac664b System.Web.Hosting.ApplicationManager.GetAppDomainWithHostingEnvironment(System.String, System.Web.Hosting.IApplicationHost, System.Web.Hosting.HostingEnvironmentParameters)
010cf2ac 6bac6595 System.Web.Hosting.ApplicationManager.CreateObjectInternal(System.String, System.Type, System.Web.Hosting.IApplicationHost, Boolean, System.Web.Hosting.HostingEnvironmentParameters)
010cf2d4 6bac1e49 System.Web.Hosting.ProcessHost.StartApplication(System.String, System.String, System.Object ByRef)
010cf320 6c165950 DomainNeutralILStubClass.IL_STUB_COMtoCLR(IntPtr, IntPtr, IntPtr)
010cf56c 6faa25a1 [GCFrame: 010cf56c]
010cf6c4 6faa25a1 [ComMethodFrame: 010cf6c4]
@Paul
Yes that's the entire output. I dont think it's a recursive function do you think is it anything else?
I'm having this exact problems (same error codes) but receive no application log from Windows Error Reporting. I also looked in the C:ProgramDataMicrosoftWindowsWERReportArchive as show in the example..but no files.
Do I need to turn something on the generate logs?
I'm trying DebugDiag. Did read down far enough.
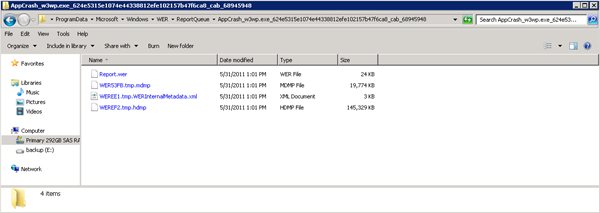
@Paul, great article, thank you for taking the time to put this together. We are experiencing this exact problem. Everything you describe, in sequence. Sometimes we go days without, other times it will fault many times in a row (in a matter of minutes). Followed your instructions, however, when I browse to the AppCrash folder, the only file present is Report.wer. None of the other files you show (most notably, the main dump file) are not there. Can you think of any reason why this would be the case? Does something need to be enabled? Thank you in advance for any guidance you can provide.
Hi Paul,
I am curious to finding out how to simulate such w3wp crashes? Please throw some light.
Regards,
Ram
Hi Ram,
Interesting question. The reason I would debug the W3WP, is because I don't know of the reason of the crash. In my case the issue was a infinite loop that only happend under certain criteria. If you are looking to simulate a crash, you could try to create an opperation that would do something similar, which would consume all your system's resources.
hello to the author,
i been using the windgb tools x64 on our production server, cause were looking for an answer why the w3wp is crashing, and when i tried to load the 2 gbz file of the memory dump files..the tools says the cannot loadlibary(c:.....net frameworksosfailed..)..what is the problem with this..anyway our production server is windows server 2008 r2 installed with a framework 2.0..